I was recently asked what conclusions I was able to draw from my analysis of web trends and color palettes and if the same could be done for the top 100 most popular sites.
I have previously used the Alexa top websites data set, and I will be using a subset of it again here.
head -n100 top-1m.csv > top-100.csv
| Rank | Site |
|---|---|
| 1 | google.com |
| 2 | facebook.com |
| 3 | youtube.com |
| 4 | baidu.com |
| 5 | yahoo.com |
| 6 | amazon.com |
| 7 | wikipedia.org |
| 8 | qq.com |
| 9 | google.co.in |
| 10 | twitter.com |
| … | … |
I'm using Selenium and PhantomJS for headless browsing and image capture. A few things worth mentioning:
set_window_size is necessary to define a reasonable (to me)
browser window width for the screenshot
set_page_load_timeout is to prevent the whole script from hanging (a bigger
problem on a poor internet connection). I timed out on a single page with an
upper bound on 2 minutes.service_args are included to avoid possible issues with bad TLS
connections and were more of a preventative measure than absolutely required.import logging
import csv
from selenium import webdriver
logging.basicConfig(level=logging.INFO)
driver = webdriver.PhantomJS(service_args=['--ignore-ssl-errors=true', '--ssl-protocol=any'])
driver.set_window_size(1024, 768)
driver.set_page_load_timeout(120)
It turns out Selenium/PhantomJS don't get along well with the protocol-less web addresses in the CSV file so I have to build a "full" URL before fetching the page.
Selenium has, for reasons I still don't understand, at least three different methods to invoke screen capture. So far as I can tell they all do the same thing and capture the full page height, which for some pages is an order of magnitude above the previously specified window height of 768.
with open('top-100.csv') as top_sites_csv:
    site_reader = csv.reader(top_sites_csv)
    for i, url in site_reader:
        try:
            full_url = "http://{}".format(url)
            logging.info("fetching: {}".format(full_url))
            driver.get(full_url)
            driver.save_screenshot("images/{}.png".format(url))
        except Exception as exc:
            logging.info(exc)

driver.quit()
To fix the issue of variable image sizes I'm once again using imagemagick:
  for i in images/*.png; do
      convert $i -crop x768+0+0 cropped-images/$i;
  done
where the x768 is not specifying a width (think of it as _x768) and the
+0+0 is specifying the start position of the crop operation in pixels. Failure
to include the start position results in n-images where n is the number of
images necessary to include the full original image (making it more of a slice
operation).
While it is possible to deconstruct the images into their component parts or RGB values with imagemagick, it provides little insight in and of itself.
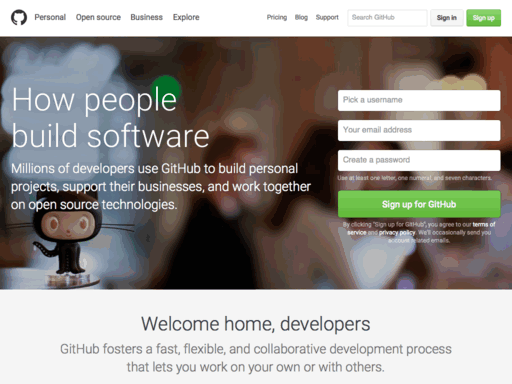
I'll be using the GitHub homepage for this example:
convert cropped-images/github.com.png txt: | head
    # ImageMagick pixel enumeration: 1024,768,255,srgba
    0,0: (255,255,255,1)  #FFFFFFFF  white
    1,0: (255,255,255,1)  #FFFFFFFF  white
    2,0: (255,255,255,1)  #FFFFFFFF  white
    3,0: (255,255,255,1)  #FFFFFFFF  white
    4,0: (255,255,255,1)  #FFFFFFFF  white
    5,0: (255,255,255,1)  #FFFFFFFF  white
    6,0: (255,255,255,1)  #FFFFFFFF  white
    7,0: (255,255,255,1)  #FFFFFFFF  white
    8,0: (255,255,255,1)  #FFFFFFFF  white
I've tried plotting the RGB values in 3 dimensional space, but even at a reduced size it's still a matter of visualizing more than 30,000 points per image in a system that has no direct application to our perception of color.
So once again, it means trying to extract the meaningful colors from the sea of data that's present in each image.
| R | G | B |
|---|---|---|
| 248 | 248 | 248 |
| 90 | 72 | 63 |
| 32 | 22 | 17 |
| 121 | 142 | 118 |
| 153 | 161 | 171 |
Disappointed with the muddled results given by imagemagick's histogram I set about doing a K-means analysis of the per-pixel RGB values in the same test image. I'm pulling most of my background on K-means from John Foreman's Data Smart, which is a decent enough introduction to (exploratory) data analysis though all of the examples are worked in Excel; and Philipp Janert's Data Analysis with Open Source Tools.
I won't bother explaining too much of what's going on here because the results were ultimately pretty lackluster. You'll note I didn't bother correcting for exceeding the RGB range in the third row. At that point it was clear that this was a more intensive solution with a worse result.
  import numpy as np
  from scipy.cluster.vq import kmeans2

  clusters = 5
  pixel_array = np.loadtxt('pixel-values.txt')
  centroids, pixels = kmeans2(pixel_array, clusters)
| R | G | B |
|---|---|---|
| 31.674 | 22.019 | 15.089 |
| 247.560 | 247.800 | 247.489 |
| 277.554 | 300.70 | 301.190 |
| 89.965 | 70.016 | 61.269 |
| 134.312 | 149.269 | 143.781 |
I think the real issue here is the limited k value forces a worse approximation of the cluster centers, possibly due to the inherent "shape" of the RGB data points. Janert claims K-means works best for globular or star-convex clusters. I haven't been able to define the RGB points' shape, but I think it may be a function of the colorspace they are expressed in. An interesting experiment would be to convert each point to HSL or XYZ and try re-plotting.
Of course, in retrospect, it makes some sense that the K-means would result in less than idea identification of prominent colors in an image such as the example given. Because of the hero image in the jumbotron there are a huge number of colors on-screen, and the K-means is simply finding a best approximation of a local minimum for the Euclidean distance in RGB values. This means the flesh-tones and the dark greys have to be factored in as much as the bright green "Sign up for GitHub" button; resulting in a more muted palette.
It occurred to me, browsing through all of the captured images, that I would necessarily have the same issue with each site that heavily relied on images (of products, of users, of advertisements). What originally prompted me to examine these sites was to try and view the palettes they were designed with, and while the images are sometimes a part of this (tumblr.com for instance) more often they are just noise.
So I re-crawled each of the sites, this time omitting images from pages with an additional parameter to PhantomJS:
  driver = webdriver.PhantomJS(service_args=['--ignore-ssl-errors=true',
                                             '--ssl-protocol=any',
                                             '--load-images=no'])
Which results in the following:

So taking a histogram of an image-less screen capture results in the following histogram from imagemagick:
While it is better without the hero image, it still fails to (in my mind) adequately capture the saturation in the green call to action. This has led me to conclude that I'm approaching the color extraction wrong and need to reassess the algorithmic approach.
Ultimately, I think this was a roundabout way to find I have been approaching the problem incorrectly. I think the next logical approach to test will be implementing a color quantization (Median Cut looks promising).