I often resort to depicting things graphically before I really understand them, enough that it is a pretty common tool in my debugging process. Occasionally people will ask me how I made a particular graphic, or how I make them so fast. This is an outline of my most productive tips.
gnuplotThis is a bit of a meta-tip, because the rest are a subset within it. I'm serious about how productive it can be. I've tried other plotting libraries (here's an interesting post on Matplotlib, and here's where I threw the MPL code away in favor of gnuplot). gnuplotting.org has a whole array of publication-ready graphs, but I'm usually too in the thick of things to be able to polish anything so well. Instead I've found the demos available in the documentation to be my quickest reference.
I deal with computers and for any time data I try to only deal in Unix epoch times in UTC. Getting to this point can be annoying if there are legacy systems doing something else, but I've got enough tooling for converting timestamps that I can predicate much of my at-work plotting on it.
set timefmt "%s"
set xdata time
This is all the prelude I typically need to get a view into my usual time-series oriented data. I've used this to gauge requests per second in performance monitoring, historical messaging rates to identify network outages, and response times for slow database queries.
If you can't deal in a nice, normalized time format like the above gnuplot does support a whole range of formats using the usual syntax.
As an example, this webserver is using the default Nginx log format (which I'll probably fix, now that I'm looking at it):
$ head /var/log/nginx/access.log
18.191.27.77 - - [27/Feb/2019:06:46:10 +0000] "GET / HTTP/1.1" 200 1578 "-" "Mozilla/5.0 (Windows NT 6.1; Win64; x64; rv:47.0) Gecko/20100101 Firefox/42.0" "-"
52.15.139.194 - - [27/Feb/2019:06:48:04 +0000] "GET / HTTP/1.1" 200 540 "-" "Mozilla/5.0 (X11; Linux x86_64) Trident/5.0 Safari/602.1" "-"
180.76.15.11 - - [27/Feb/2019:07:02:10 +0000] "GET /simply-write/style.css HTTP/1.1" 301 178 "-" "Mozilla/5.0 (compatible; Baiduspider/2.0; +http://www.baidu.com/search/spider.html)" "-"
180.76.15.162 - - [27/Feb/2019:07:02:11 +0000] "GET /simply-write/style.css HTTP/1.1" 200 879 "-" "Mozilla/5.0 (compatible; Baiduspider/2.0; +http://www.baidu.com/search/spider.html)" "-"
180.76.15.22 - - [27/Feb/2019:07:02:11 +0000] "GET /robots.txt HTTP/1.1" 301 178 "-" "Mozilla/5.0 (Windows NT 5.1; rv:6.0.2) Gecko/20100101 Firefox/6.0.2" "-"
180.76.15.151 - - [27/Feb/2019:07:02:11 +0000] "GET /robots.txt HTTP/1.1" 301 178 "-" "Mozilla/5.0 (Windows NT 5.1; rv:6.0.2) Gecko/20100101 Firefox/6.0.2" "-"
180.76.15.8 - - [27/Feb/2019:07:02:13 +0000] "GET /robots.txt HTTP/1.1" 404 233 "-" "Mozilla/5.0 (Windows NT 5.1; rv:6.0.2) Gecko/20100101 Firefox/6.0.2" "-"
180.76.15.7 - - [27/Feb/2019:07:02:13 +0000] "GET /robots.txt HTTP/1.1" 404 233 "-" "Mozilla/5.0 (Windows NT 5.1; rv:6.0.2) Gecko/20100101 Firefox/6.0.2" "-"
193.106.30.98 - - [27/Feb/2019:07:16:14 +0000] "POST /wp-includes/locale.php HTTP/1.1" 301 178 "-" "Mozilla/5.0 (Windows NT 6.1; rv:34.0) Gecko/20100101 Firefox/34.0" "-"
193.106.30.98 - - [27/Feb/2019:07:16:28 +0000] "GET /wp-includes/locale.php HTTP/1.1" 404 328 "-" "Mozilla/5.0 (Windows NT 6.1; rv:34.0) Gecko/20100101 Firefox/34.0" "-"
If I want to see requests per second, I might reformat it to my preferred time format using a touched up version of this Stack Overflow answer:
gawk 'BEGIN {
    FS="[][]"
}
{
    split($2,a,"[/: ]")
    match("JanFebMarAprMayJunJulAugSepOctNovDec",a[2])
    a[2] = sprintf("%02d",(RSTART+2)/3)
    secs = mktime(a[3]" "a[2]" "a[1]" "a[4]" "a[5]" "a[6])
    print secs, $0
}
' access.log > timestamps.log
Which will just prepend a Unix timestamp:
1551267970 18.191.27.77 - - [27/Feb/2019:06:46:10 +0000] "GET / HTTP/1.1" 200 1578 "-" "Mozilla/5.0 (Windows NT 6.1; Win64; x64; rv:47.0) Gecko/20100101 Firefox/42.0" "-"
1551268084 52.15.139.194 - - [27/Feb/2019:06:48:04 +0000] "GET / HTTP/1.1" 200 540 "-" "Mozilla/5.0 (X11; Linux x86_64) Trident/5.0 Safari/602.1" "-"
1551268930 180.76.15.11 - - [27/Feb/2019:07:02:10 +0000] "GET /simply-write/style.css HTTP/1.1" 301 178 "-" "Mozilla/5.0 (compatible; Baiduspider/2.0; +http://www.baidu.com/search/spider.html)" "-"
1551268931 180.76.15.162 - - [27/Feb/2019:07:02:11 +0000] "GET /simply-write/style.css HTTP/1.1" 200 879 "-" "Mozilla/5.0 (compatible; Baiduspider/2.0; +http://www.baidu.com/search/spider.html)" "-"
1551268931 180.76.15.22 - - [27/Feb/2019:07:02:11 +0000] "GET /robots.txt HTTP/1.1" 301 178 "-" "Mozilla/5.0 (Windows NT 5.1; rv:6.0.2) Gecko/20100101 Firefox/6.0.2" "-"
1551268931 180.76.15.151 - - [27/Feb/2019:07:02:11 +0000] "GET /robots.txt HTTP/1.1" 301 178 "-" "Mozilla/5.0 (Windows NT 5.1; rv:6.0.2) Gecko/20100101 Firefox/6.0.2" "-"
1551268933 180.76.15.8 - - [27/Feb/2019:07:02:13 +0000] "GET /robots.txt HTTP/1.1" 404 233 "-" "Mozilla/5.0 (Windows NT 5.1; rv:6.0.2) Gecko/20100101 Firefox/6.0.2" "-"
1551268933 180.76.15.7 - - [27/Feb/2019:07:02:13 +0000] "GET /robots.txt HTTP/1.1" 404 233 "-" "Mozilla/5.0 (Windows NT 5.1; rv:6.0.2) Gecko/20100101 Firefox/6.0.2" "-"
1551269774 193.106.30.98 - - [27/Feb/2019:07:16:14 +0000] "POST /wp-includes/locale.php HTTP/1.1" 301 178 "-" "Mozilla/5.0 (Windows NT 6.1; rv:34.0) Gecko/20100101 Firefox/34.0" "-"
1551269788 193.106.30.98 - - [27/Feb/2019:07:16:28 +0000] "GET /wp-includes/locale.php HTTP/1.1" 404 328 "-" "Mozilla/5.0 (Windows NT 6.1; rv:34.0) Gecko/20100101 Firefox/34.0" "-"
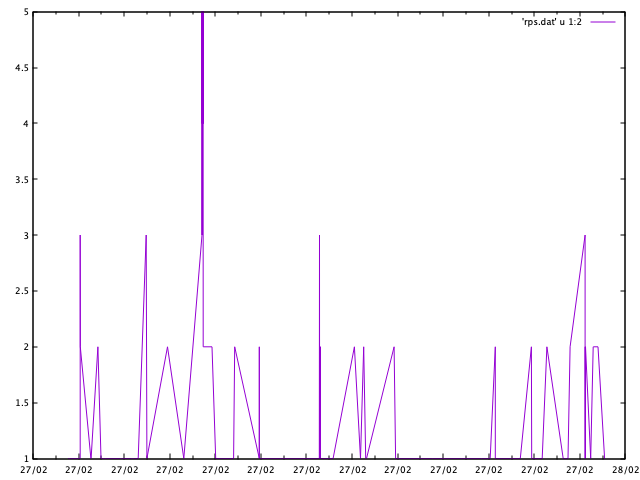
A neat trick for requests per second is to lean on the sorted nature of the log file and do:
cut -d' ' -f1 timestamps.log | uniq -c | awk '{ print $2, $1 }' > rps.dat
Which performs a count of the timestamp value and then swaps the two columns, resulting in:
1551267970 1
1551268084 1
1551268930 1
1551268931 3
1551268933 2
1551269774 1
1551269788 1
1551270324 2
1551270572 1
1551270764 1
This can be plotted directly with:
plot 'rps.dat' using 1:2 with lines
If the fact that the y-axis contains fractional "requests per second"
you can limit it to only integers with set ytics 1.
I really like the utility of this one plot, it is curiously effective at knocking down specious arguments about performance and scale. I've also used it to identify bugs in a batch operation that was supposed to rate-limit network requests to once a second — simply reading the code was insufficient to convince others that there was a problem, but a plot clearly demonstrated that dozens of requests were happening after grepping the logs for timestamps and then plotting them.
One feature I tend to discourage using is the ability for gnuplot to
perform conditional handling as part of the plotting logic. I have
struggled to maintain a few plots that used what might be a neat
feature but found it not really worth the effort. I tend to do all my
processing prior to any plotting and have found that multiple plots
are usually easier to understand than a more complicated single plot.
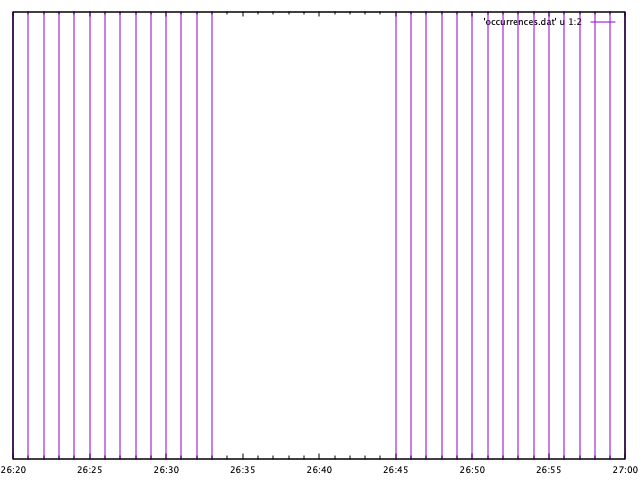
In tracking down a bug across multiple processes using a variety of asynchronous code and message queues I came to a kind of logical assertion that A happening implies B happens and C happens, albeit not quite simultaneously. I wanted some way to visualize what was millions of events of three types in a single dimension, time. I was looking for a pattern of "holes" in the time-series, though I didn't know it at the time. You can imagine a simplified event log like the following, if there were only one event type:
1551255989 occurred
1551255990 occurred
1551255991 occurred
1551255992 occurred
1551255993 occurred
1551255994 nil
1551255995 nil
1551255996 nil
1551255997 nil
1551255998 nil
1551255999 nil
1551256000 nil
1551256001 nil
1551256002 nil
1551256003 nil
1551256004 nil
1551256005 occurred
1551256006 occurred
1551256007 occurred
1551256008 occurred
Where instead of 19 points in time there were millions interspersed with hundreds of other data points. As an example of how conditional formatting could be used, I first used a string comparison to draw an impulse plot of events:
plot 'event.log' using 1:(stringcolumn(2) eq "nil" ? 0 : 1) with impulses
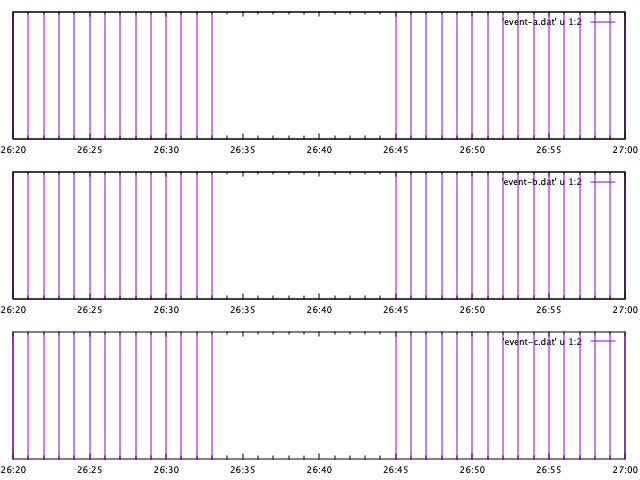
And this works for the above example, but often my data is not quite so straight-forward that there is only a second column of a fixed string value. Instead, the first level of pre-processing should have been to limit a plot to only one event type for which I ended up using awk to filter the data by type and substituting the string value with a simple tally marker:
$ awk '/event a/ { print $1, 1 }' event.log > event-a.dat
$ awk '/event b/ { print $1, 1 }' event.log > event-b.dat
$ awk '/event c/ { print $1, 1 }' event.log > event-c.dat
In my particular case, I used about a half-dozen of these impulse graphs before I was able to correlate the "holes" with a particular function call establishing a series of message subscriptions. When a subscription was lost due to network disconnects three separate messages subscriptions failed to recover. To achieve this side by side comparison I leaned on the multiplot capabilities of gnuplot. From there, it is easy to create a single "stacked" chart of these three events:
gnuplot> set multiplot layout 3,1
multiplot> plot 'event-a.dat' u 1:2 w impulses
multiplot> plot 'event-b.dat' u 1:2 w impulses
multiplot> plot 'event-c.dat' u 1:2 w impulses
It is a little funny to me how broadly applicable these are in practice, not simply in plotting effectively. The title of this post is facetious because I've found there isn't any real magic to leveraging gnuplot as a tool in debugging and making convincing technical arguments.